By Arch Ritter, November 3 2011
The 2011 United Nations Development Program (UNDP) Human Development Report (HDR) was just published on November 2.
Cuba is back in the main Human Development Index (HDI) and the statistical tables of the 2011 HDR after a complete absence last year mainly due to its unorthodox measurement of Gross Domestic Product (GDP), a central component of the HDI. Presumably the UNDP now accepts Cuba’s approach and its HDI is recalculated and is presented for the 1985 to 2011 period.
The 2011 Human Development Report is especially interesting this year focusing on Environment and Equity issues and including statistical measures in both of these areas for all countries of the world for which such data is available. The UNDP HDR is the most reliable and comprehensive “Report Card” on most aspects of human development (though with little attention to the political dimension) for all countries of the world).
The full report is available and can be down-loaded here: Human Development Report 2011, Sustainability and Equity: A Better Future for All; http://hdr.undp.org/en/reports/global/hdr2011/download/
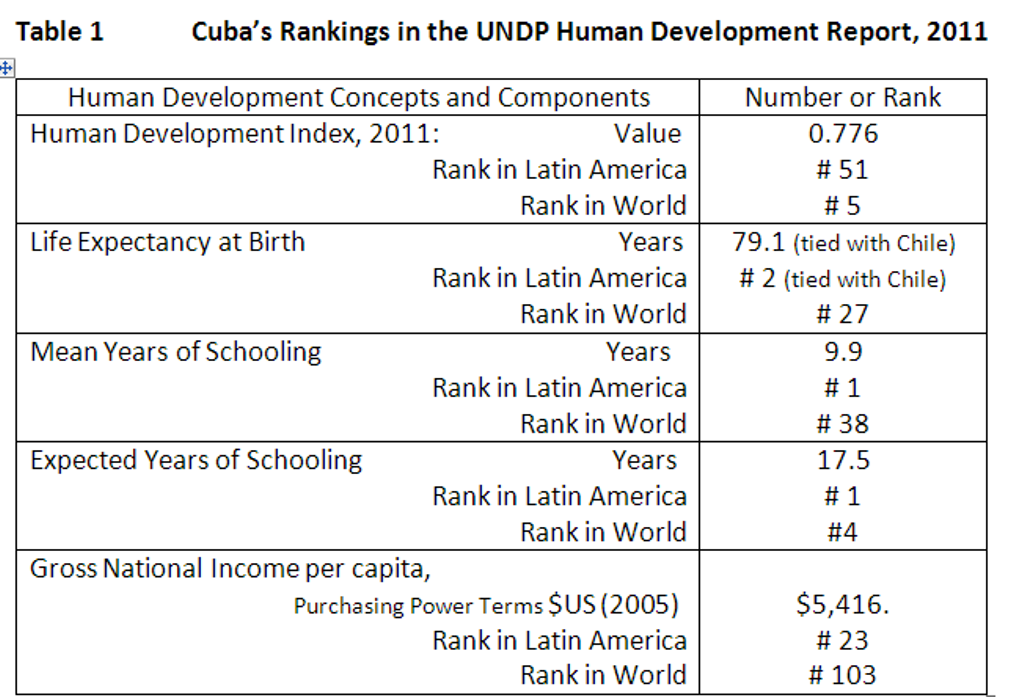
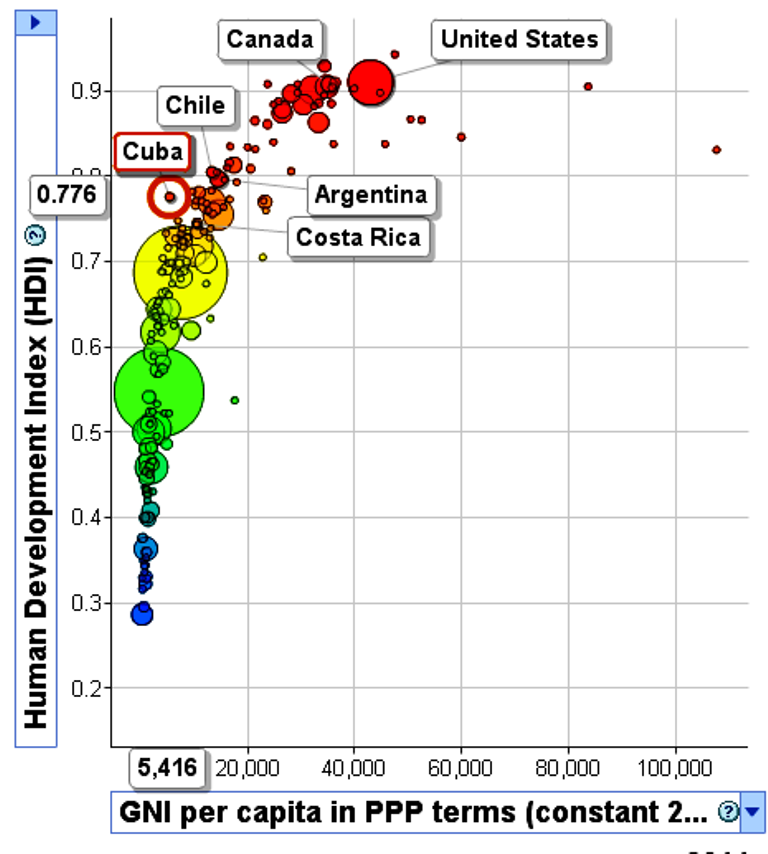
Cuba’s place in the 2011 Human Development Index is summarized in Table 1. The basic methodology used for the HDI measure is described below in the Appendix. Cuba’s overall ranking in the world is # 51 for 2011 – the same ranking as in 2009 which used a somewhat different methodology. Its rank in Latin America in 2011 was # 5, up from # 6 in 2009. Interestingly enough, Cuba can be seen in Chart 1, as somewhat of an “outlier” in that its Gross National Income per capita is relatively low while its overall HDI is high.
 Source: UNDP Human Development Report, 2011
Chart 1. Cuba’s Human Development Index and Gross National Income per capita in Purchasing Power terms in 2011 in Comparative International perspective.
 Source: Calculated from UNDP HDR 2011
Of the three components of the HDI, Cuba did poorly in the Gross National Income measure, placing 23rd in Latin America and 103rd in the world. The Life Expectancy component was strong, though Cuba was behind Costa Rica for this indicator and tied with Chile. The “Mean Years of Schooling” measure at 9.9 years is probably not unreasonable.
The big surprise in the HDI calculation is the second element of the education component. The “Expected Years of Schooling” indicator is an amazing 17.5 years, ahead of all other countries in the world with the exception of Iceland, Ireland, and Australia. This is a curious result and presumably is due to a mechanical calculation based on current enrolment at all levels of education and population of official school age for each level of education. The number for this sub-component accounts for about one-sixth of the weight for the whole HDI measure. This number is high perhaps because of the enrolments at Municipal Universities and the retraining of displaced sugar sector workers that seems to still be continuing. The quality of expected years of education is not considered. As a genuine indicator of human development, this measure is weak because, unlike Life Expectancy and GNI per capita, it measures input and effort more so than output and the result.
The trend of Cuba’s HDI from 1985 to 2011 and is illustrated in Chart 2 in comparison with the long-term HDI trends for the other countries of Latin America and the Caribbean. (The measure for Cuba is the light blue line with that includes the HDI numbers. The other countries of the region are in the darker colours, but unfortunately are unmarked.) The decline of the HDI according to this new UNDP measure after about 1989 is apparent, reflecting the 35% reduction in GDP per person from 1990 to 1993. Reasonably steady improvement then occurred right to 2011, as a result of the improvements in GDP per capita and steady improvements in health and education.
Chart 2. Cuba’s Human Development Index Trend, 1985-2011, in Comparative Latin American Perspective
Source: Calculated from UNDP HDR 2011
Some of the environmental numbers for Cuba are of interest, though the coverage is incomplete. Some other variants of the HDI, namely the ”Inequality-adjusted HDI” and the “Multi-Dimensional Poverty Index” exclude Cuba, presumably for lack of data.
Appendix: Measurement of the 2011 Human Development Index; (from UNDP HPR 2011) See http://hdr.undp.org/en/statistics/hdi/
The education component of the HDI is now measured by mean of years of schooling for adults aged 25 years and expected years of schooling for children of school entering age. Mean years of schooling is estimated based on educational attainment data from censuses and surveys available in the UNESCO Institute for Statistics database and Barro and Lee (2010) methodology). Expected years of schooling estimates are based on enrolment by age at all levels of education and population of official school age for each level of education. Expected years of schooling is capped at 18 years. The indicators are normalized using a minimum value of zero and maximum values are set to the actual observed maximum value of mean years of schooling from the countries in the time series, 1980–2010, that is 13.1 years estimated for Czech Republic in 2005. Expected years of schooling is maximized by its cap at 18 years. The education index is the geometric mean of two indices. The life expectancy at birth component of the HDI is calculated using a minimum value of 20 years and maximum value of 83.4 years. This is the observed maximum value of the indicators from the countries in the time series, 1980–2010. Thus, the longevity component for a country where life expectancy birth is 55 years would be 0.552. For the wealth component, the goalpost for minimum income is $100 (PPP) and the maximum is $107,721 (PPP), both estimated during the same period, 1980-2011. The decent standard of living component is measured by GNI per capita (PPP$) instead of GDP per capita (PPP$) The HDI uses the logarithm of income, to reflect the diminishing importance of income with increasing GNI. The scores for the three HDI dimension indices are then aggregated into a composite index using geometric mean. Refer to the Human Development Report 2011 Technical notes [388 KB] for more details.


This Index also has to change with time. It is highly imperfect, in the sense that it does not consider the “Civilised nature of Humanity” or its “ moral values”.
As an example, in India the hiest Index value is for Kerala, but unfortunately the the “Crime Capital of India” is Kochi, a central City in Kerala. Can we go by this Index? It seems to requires modifications.
It will take takes time, as society moves at a slow speed compared to human Ideas.
Gopinathan Krishnan, a scientist belonging to India, part of the “7 th world”:
I will like to add that if the human development index is to measure human well-being accurately it must account for law enforcement and educational attainment. This means the crime rate per population and the law enforcement workers to population ratio. The educational attainment can be percentage of population with a post-graduate education, degree, other tertiary, secondary, basic education certificates and those with no certificate but have attended school and those who have never attended. This will force a lot of development economists to look at outcomes.