Tag Archives: UNDP HDR 2010

Infant Mortality in Cuba: Myth and Reality

 Roberto M. Gonzalez, Department of Economics, UNC, Chapel Hill

An interesting paper on Cuba’s Infant Mortality Rate (IMR) was presented at the 2013 meetings of the Association for the Study of the Cuban Economy by Roberto M. Gonzalez, a graduate student in Economics at the University of North Carolina. The paper is especially interesting as it focuses on one important indicator of the quality of the health system, human development and socio-economic development which ostensibly has been a major achievement for Cuba. Cuba’s exceedingly low Infant Mortality Rate has been a major “logro” of the Revolution and a source o pride since the early 1960s.

Gonzalez presents information and analysis that casts some doubt on the official IMR figures. His complete argument can be seen in the Power Point presentation that he made at the ASCE meetings here: Infant Mortality in Cuba

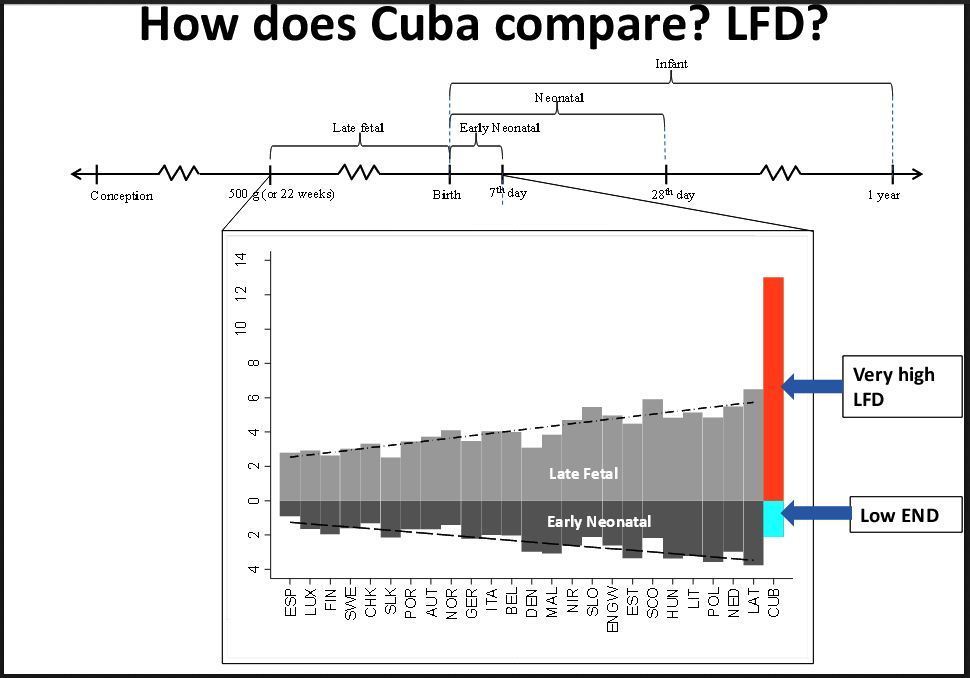
The essence of his argument is that Late Fetal Deaths (LFDs) or deaths of fetuses weighing at least 500 grams are abnormally high in Cuba compared to other countries while Early Neonatal Deaths (ENDs) or deaths occurring in the first week of life are abnormally low. In the chart below, Cuba’s high LFD in orange and its low END in green can quickly be seen as outliers for the countries of Europe.

New Picture (12)What’s going on here? Perhaps it is reflects an erroneous mis-classification system, or purposeful mis-reporting or possibly late term and mislabeled abortions (if there is any chance of infant ill-health or a congenital health problems.)

While perhaps further work is needed to analyze this LFD-END puzzle, Gonzalez work has certainly raised serious questions about Cuba’s long-vaunted Infant Mortality Rate.

New Picture (14a )

Posted in Blog | Tagged , , , , | Leave a comment

An Overview Evaluation of Economic Policy in Cuba circa 2010

By Arch Ritter

The essay attached and summarized briefly here was presented at a conference at CIAPA, in San Jose, Costa Rica, February 3 and 4, 2009 organized by Paolo Spadonu of Tulane University.

The full essay is entitled An Overview Evaluation of Economic Policy in Cuba, circa 2010, June 30, 2010 and can be seen “HERE”. The Introduction and Conclusion are presented below.

Hopefully, this evaluation will change considerably for the better after the Sixth Congress of the Communist party of Cuba in April.

I. Introduction

The economic development of Cuba has been characterized by high levels of investment in people with successful results, but with weak performance in terms of the production of goods and services generally. Cuba’s achievements regarding human development are well known and are epitomized by the United Nations Development Program’s “Human Development Index” (HDI). On the one hand, this index ranks Cuba at #1 in the world for the Education component (somewhat surprisingly) and #31for the Life Expectancy component. On the other hand, Cuba’s world ranking is for GDP per capita in purchasing power parity terms is #94 with an overall world HDI ranking of #51(UNDP, HDR, 2009, 271.) These rankings underline the inconsistency between the Cuba’s high level of human development on the one hand and its economic underperformance on the other. The strong economic performance of the 2004 to 2008 period appeared to constitute a rapid recovery in terms of Cuban GDP statistics. However, this recovery, while perhaps not illusory, was fragile and unsustainable, based on factors such as support from Venezuela and high nickel export prices, and indeed it has been reversed in 2009-2010.

Given the quality of Cuba’s human resources, the economic performance for the last 15 years should have been excellent. The central argument of this essay is that Cuba’s weak economic performance has been the result of counter-productive public policy. The objective of this essay is to analyze and evaluate a number of central policy areas that shape Cuba’s economic performance, including monetary and exchange rate policy, policy towards micro-enterprise; agricultural policy, labor policy, foreign investment policy, policies towards infrastructure renewal, and the policy approach to self-correction and self-renewal.

In order to present a brief overview of the evaluations, an academic style of grading is employed, with an “A+” being excellent through to an “F” representing “failure”.

This evaluation schema is of course subjective, impressionistic and suggestive rather than rigorous. It is based on brief analyses of the various policy areas. However, the schema is similar to the scoring systems widely used in academia, and is used here with no more apology than is normally the case in the academic world.

Before proceeding with the policy analysis and evaluation, a brief overview of economic performance in the decade of the 2000s is presented to provide the context for the examinations of economic policy.

II. General Economic Performance

III.  Evaluation of Some Central Policy Areas

IV.   Summary and Conclusion:

A summary of the evaluations of the various assessment areas yields an overall evaluation of   “D +”. This is not a strong assessment of Cuban economic policies.

1. Monetary & Exchange Rate Policy                  C-

2. Micro-Enterprise Policy                                    F

3. Policy towards Agriculture                              C-

4. Labor Policy                                                        D+

5. Foreign Investment Policy D+

6. Infrastructure Renewal                                   D

7. Capacity for Self Correction                            D

Overall Grade: D +

The result of such weak policies in these areas is weak economic performance. Badly conceived economic policies nullify the potential efforts of the Cuban citizenry. The major investments in human capital, while fine in their own right, are not yielding strong economic performance. Indeed, misguided policies are undermining, sabotaging and wasting the economic energies and initiatives of Cuba’s citizens.

Major policy reforms amounting to a strategic reorientation of Cuban economic management are likely necessary to achieve a sustained economic recovery and future economic trajectory. So far, writing in June 2010, the Government of Raul Castro has made some modest moves, principally in agriculture, as mentioned earlier. Other policy areas such as those relating to micro-enterprise are reported to be under discussion at high levels in the government. On the other hand, the replacement of the reputed pragmatists Carlos Lage, (Secretary of the Council of Ministers) and Jose Luis Rodriguez, (Vice President of the Council of Ministers and Minister of Economy and Planning) and the replacement of Lage by Major General José Amado Ricardo Guerra of the Armed Forces seems to suggest that the Raul Castro Government may be moving towards a less reformist approach to economic management ( Granma International, 2009.)

The types of policy reforms that would be necessary to strengthen the policy areas discussed above would include the following:

  1. Monetary & Exchange Rate Policy: movement towards realistic and unified monetary and exchange rate systems;
  2. Micro-Enterprise Policy: establishment of an enabling and supportive policy environment rather than a punitive policy of containment;
  3. Policy towards Agriculture: further support for small-scale farmers plus a reinvigoration of the abandoned sugar fields with cane for ethanol, among other policies;
  4. Labor Policy: implement the International Labour Organization approach to fundamental labor rights;
  5. Foreign Investment Policy: establish a clearer and more unequivocal rules-based policy framework;
  6. Infrastructure Renewal: strengthening resource flows towards maintenance, especially for housing, water, and sanitation, and facilitating self-managed and do-it-yourself maintenance on the housing stock by liberalizing the trades and making repair supplies available at reasonable cost;
  7. Capacity for Self Correction: permit an authentic implementation of freedom of expression and freedom of association thereby permitting economic analysis and criticism through a free press and media and the formation of alternate “teams” of potential economic managers – some within political parties.

In sum, effective economic management requires new ideas, transparency and criticism, and, indeed, a major policy reform process in order to reverse the current wastage of human energies, talents and resources. Policy reorientations in the directions noted above are unlikely to be forthcoming from the Government of Raul Castro, which appears to be deeply conservative as well as “gerontocratic”. Cuba will likely have to wait for a “New Team” or more likely a “generational change” in its overall economic management before such major reforms can be implemented.


Posted in Blog, Featured | Tagged , , , , , , , , , , , , , , , , , | Leave a comment

Cuba’s Standings in Social, Political, Economic and Environmental Indices in Comparative International Perspective

By Arch Ritter

In the last week of January 2011, the Heritage Foundation (HF), a conservative US “Think Tank”. published its 2011 Report on Economic Freedom. No surprise: Cuba ranks #175 of the 177 countries included in that report, ahead only of North Korea and Zimbabwe.

The concept or definition used for “Economic Freedom” is:

“Economic freedom is the fundamental right of every human to control his or her own labor and property. In an economically free society, individuals are free to work, produce, consume, and invest in any way they please, with that freedom both protected by the state and unconstrained by the state. In economically free societies, governments allow labor, capital and goods to move freely, and refrain from coercion or constraint of liberty beyond the extent necessary to protect and maintain liberty itself.”

The components of economic freedom in the Heritage Foundation’s definition include business freedom, trade freedom; fiscal freedom, government spending, monetary freedom, investment freedom, financial freedom, property rights, freedom from corruption, and labor freedom.

What the HF definition misses is the capability to utilize one’s freedom, such as good health, a useful education, and a reasonable income. Presumably the HF types of freedom are more effective when people live longer, have good health so that they can work and appreciate life, and are not mired in poverty. Cuba would score better if life expectancy, health, education and income distributional measures were included in the concept and the index.

Other Measures of Human Achievement or Performance

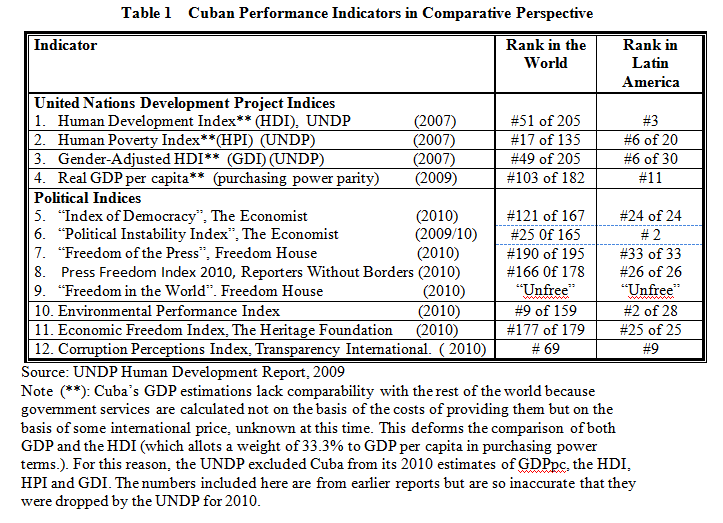
The HF’s Economic Freedom Index brought to mind some other measures of social, economic, environmental and political performance. A listing of these and Cuba’s place therein is presented in Table 1 and hyperlinks to some basic definitions and methodological sources are summarized in the next section.

Again, it is no surprise that Cuba fares badly on the political and economic freedom rankings, coming at the very bottom in Latin America on the “democracy” and “freedom of the press” rankings.

Cuba’s high ranking for the EIU Political Instability Index – second only to Costa Rica- is unexpected. Cuba would have scored well on “ethnic fragmentation”, labor unrest (no strikes, collective bargaining or independent unions), economic growth in 2009, income inequality (as officially measured), unemployment (at least the official rate) and “status of minorities”.

Cuba’s standing in the “corruption perceptions” listing does not seem unreasonable.

Cuba’s high standing in the Environmental Performance rankings – again second only to Costa Rica-  will be a surprise to those who have spent time inhaling the exhaust of urban traffic in Havana or observing the fumes of the Havana’s thermal electric plant, pictured below.  Indeed, a close study of the Yale-Columbia-World Economic Forum calculations for Cuba would be worthwhile. One suspects some statistical creativity such as has been employed in the area of basic economic measures such as GDP, unemployment and the Consumer price Index.
Data Sources and Methodology

The full sources of the information are hyperlinked below. The methodologies can also be found at these web sites.

UNDP Measures

1, 2, 3, and 4: Human Development Index 2009, HDR 2009 Statistical Tables

Democracy Measures

5.      The Economist Intelligence Unit’s Index of Democracy 2010,  This index is based on electoral process and pluralism; civil liberties; the functioning of government; political participation; and political culture.

6.      The Economist Intelligence Unit’s “Political Instability Index”. This measure is based on   I. Underlying vulnerability: 1.Inequality Measured by Gini coefficient; 2.State history; 3.Corruption; 4.Ethnic fragmentation; 5.Trust in institutions; 6. Status of minorities; 7.History of political instability; 8.Proclivity to labor unrest; 9.Level of social provision; 10.A country’s neighborhood; 11.Regime type; 12.Regime type and factionalism and II. Economic distress: 1.Growth in incomes Growth in real GDP per head in 2009; 2.Unemployment; 3.Level of income per head

7.      Freedom House, Freedom of the Press index an annual survey of media independence in 195 countries and territories. “The index asesses the degree of print, broadcast, and internet freedom in every country in the world, provides numerical rankings and rates each country’s media as “Free,” “Partly Free,” or “Not Free.””  Freedom House, Freedom of the Press, 2010

8. Press Freedom Index 2010, Reporters Without Borders

9. Freedom House, Freedom in the World, 2010, Tables and Graphs measures freedom according to political rights and civil liberties.

(See also Wikipedia’s list of freedom indices.)

10. The 2010 ENVIRONMENTAL PERFORMANCE INDEX, of the Yale Center for Environmental Law & Policy, Yale University and Center for International Earth Science Information Network, Columbia University and the World Economic Forum. This measure includes some 25 indicators in 10 categories including Environmental Health. Air Pollution (effects on humans), Water (effects on humans), Air Pollution (effects on ecosystems), Water (effects on ecosystems), Biodiversity and Habitat, Forestry, Fisheries, Agriculture and Climate Change

11. “Index of Economic Freedom” The Heritage Foundation. (See discussion above.)

12. Transparency International. Corruption Perceptions Index Report, 2010
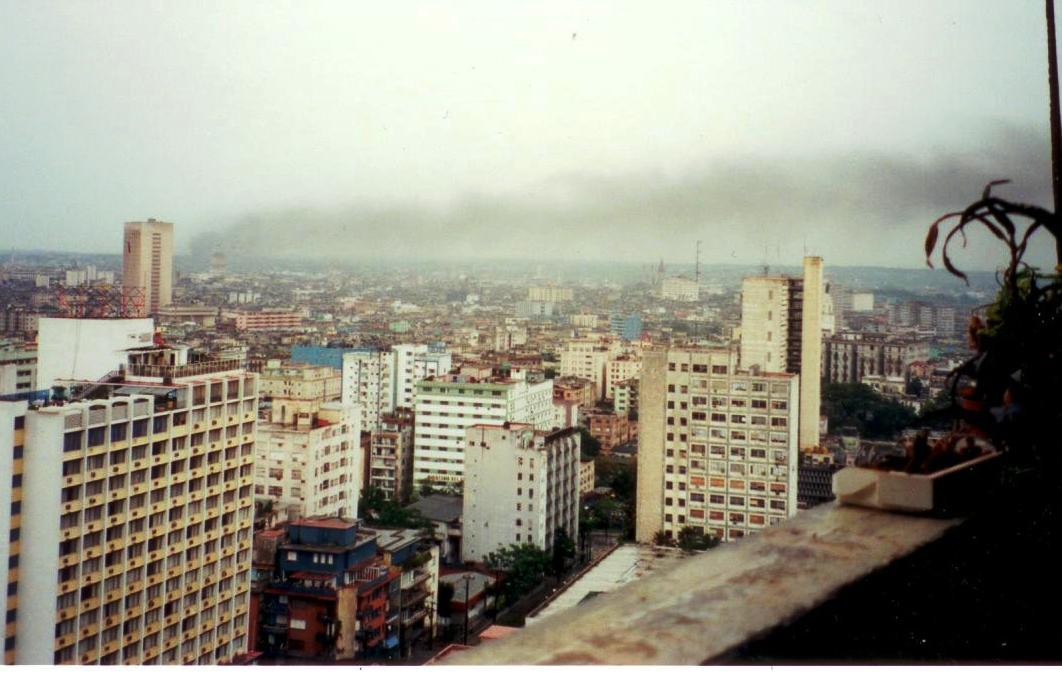
Havana Thermal-Electric Plant, from Edificio Fochsa, Hotel Capri on the left, 1997, Photo by Arch Ritter
Posted in Blog, Featured | Tagged , , , , , , | Leave a comment

Still the “Bestest” and the “Worstest” and Maybe the Most Opaque: Cuba in the 2010 UNDP Human Development Report

By Arch Ritter

The 2010 UNDP Human Development Report , published on November 5, 2010, presents the definitive and much-awaited “Report Card” on the social, economic, political, environmental and security dimensions of development for all countries of the world. In this Report, Cuba fares well in some indices, badly on others, but is also “out-of-the-running” on the major UNDP Human Development Indices due to lack of reliable information.

The whole of the UNDP Human Development Report can be accessed here:   2010http://hdr.undp.org/en/mediacentre/

Here are a few of the interesting comparative insights and results for Cuba.

1.      Main Human Development Indices

Cuba is excluded from the main Human Development Indices that the UNDP presents, namely the Human Development Index (Table 1), the Inequality-adjusted Human development Index (HDI) (Table 2) and the Multidimensional Poverty Index (Table 5)  as well as the HDI Trends from 1980 to 2010 (Table 3). This is unfortunate because it is not possible this year to make a comparison of Cuba with other countries or with itself over time.

Due to the existence of the dual exchange rate system in which there is no reasonable single exchange rate, together with the complexity of the highly segmented markets – underground economy, rationing system, farmer’s markets, non-market allocation of some goods and services, and quasi-dollar stores – it was concluded by the UNDP that it was impossible at this time to construct a measure of GDP per capita in purchasing power terms as is done for some 169 other countries. . The UNDP apparently is working with the Government of Cuba to correct this situation. The UNDP’s explanation of the problem is presented in Appendix 1.

2.      Gender Inequality Index

Cuba comes first in Latin America and 47th in the world for this measure, which includes maternal mortality rates, adolescent fertility rate, share of parliamentary seats held by each sex, attainment at secondary and higher education, labor market participation rates, contraception availability, and births attended by health personnel (Table 4).

3.      “Empowerment”” Measures

In a new dimension of its analysis (Table 6), the UNDP brings together a variety of indicators of human “empowerment.”  Cuba fares uniformly badly, and indeed worst in Latin America for many measures:

  • “Democracy”: worst in Latin America;
  • “Press Freedom”: worst in the world, including China;
  • “Satisfaction with Freedom of Choice”: worst in Latin America, with 26% and 28% satisfaction for males and females respectively;
  • “Journalists Imprisoned”: worst in the world with the exception of  China;
  • “Human Rights Violations”: among the worst.

4.      Education

Cuba fares well in education generally (Table 13). One notable feature of Cuba’s comparative experience is that it has the largest tertiary education enrolment in the Hemisphere and the world at 121.5% compared to an average of 36.5% for all of Latin America.

How can this be? Presumably more people than are in the normal tertiary education age cohort are attending colleges or University. This is the result of increasing the supply of tertiary education, by creating alleged “Universities” in every Municipality, plus an increase in the demand for higher education by those who have been put out of work in various areas including the sugar sector. It is difficult to know without further information if the 121.5% figure represents an achievement or a gross misallocation of resources given that Cuba needs to produce real products in agriculture and industry, and seems to be overproducing university graduates – not unlike some higher income countries .

5.      Health

As is well-known, Cuba also fares well in health measures and has been particularly successful in squeezing strong health outcomes from very scarce resources (Table 14).

One interesting measure is the number of doctors per 10,000 people that stands at 64 for Cuba. This again is the highest ration by far in Latin America and the world. Again, this looks like an over-allocation of resources to the “doctor” category in health. However, given that the 30,000 doctors abroad are now the largest earner of foreign exchange for Cuba, it is likely that this over-abundant resource is now being used effectively.

6.      Access to Information and Communications Technology.

Cuba’s performance is in communications and access information is also the weakest in the Hemisphere. Here are a number of indicators noted by the UNDP (Table 16).

  • The access of Cubans to land-line and mobile telephones stands at 13%. This is by far the lowest in the Hemisphere. Even the lower income countries in the region have much higher access to telephones, with Haiti at 33%, Nicaragua 60%, Guatemala 120%; Grenada 86%, El Salvador 131%, Paraguay 103%m and Honduras 96%.
  • The cost of a mobile telephone connection in Cuba is by far the highest in the world, at $120.00.  Obviously this limits the demand for mobile connections and helps explain Cuba’s 13% access rate.
  • Access to the internet is particularly low at 12.9 per 100 persons, though not the lowest in the Hemisphere.
  • The proportion of the population with personal computers was estimated at 5.6 per 100 persons, again low but not the lowest in the Hemisphere.

This illustration shows the HDI trajectories for all countries of the world from 1980 to 2010, excepting Cuba and a few others.
Appendix !: Purchasing power parity conversions and the HDI: an illustration with the case of Cuba (Source: UNDP,  HDR 2010, p.138).

The HDI uses internationally comparable data on gross national income (GNI) per capita from the World Bank (2010g). These data are expressed using a conversion factor that allows comparisons of prices across countries. This conversion, known as purchasing power parity (PPP), is necessary to take into account differences in the value of a dollar across countries.  Four countries have data on all HDI components except for GNI: Cuba, Iraq, Marshall Islands and Palau. For three of these countries (Cuba, Marshall Islands and Palau) this is due to the fact that they do not participate in the International Comparisons Program. Iraq lacks information about GNI for the last 10 years.
To illustrate the options and problems that arise in attempting to reliably estimate GNI per capita in PPP terms, Cuba is used as an example. One well known approach to estimating GNI—used by the Center for International Comparisons of Production, Income and Prices at the University of Pennsylvania (Heston, Summers and Aten 2009)—is a regression that relies on data from the salaries of international civil servants converted at the official exchange rate. However, because the markets in which foreigners purchase goods and services tend to be separated from the rest of the economy, these data can be a weak guide to the prices citizens face in practice. The Center for International Comparisons of Production, Income and Prices recognizes this problem, rating its own estimate of Cuba’s GDP as a “D” (the lowest grade).
An alternative estimate applies the exchange rate used in Cuba and the PPP conversion of an economy with similar attributes, but this method goes against the principle of using a country’s legally recognized exchange rate and prices to convert its national aggregates to an international currency. Another option is to not apply any PPP correction factor to the official exchange rate for convertible pesos. Both of these options yield far lower estimated income than the PPP correction does. The wide variation in income estimates arising from these different techniques indicates that no single robust method exists in the absence of reliable data.
Posted in Blog, Featured | Tagged , , , , , , | Leave a comment